During the Spring semester of the 2025-2026 school year, I as well as two other group members were tasked to create a working application that performs all of the skills that the Computing Methods II course teaches students of Industrial Engineering and Operations Analytics at the University of Arkansas. We started off the process of building this application by deciding what topic we would want to work around, with myself and another group member being avid baseball enthusiasts, we decided to create an application that would be able to take data from a data set that we uploaded, clean it, and then output the most optimal way to order a batting lineup using the players that the user selects. The other aspect of our application was that it would have a second feature that could output a predicted offensive score based on statistics that we use while building our model. We would not have been able to create this application without the knowledge that this course gave us on multiple topics such as implementing Tablesaw methods, Vaadin methods, SMILE Regression, and much more!
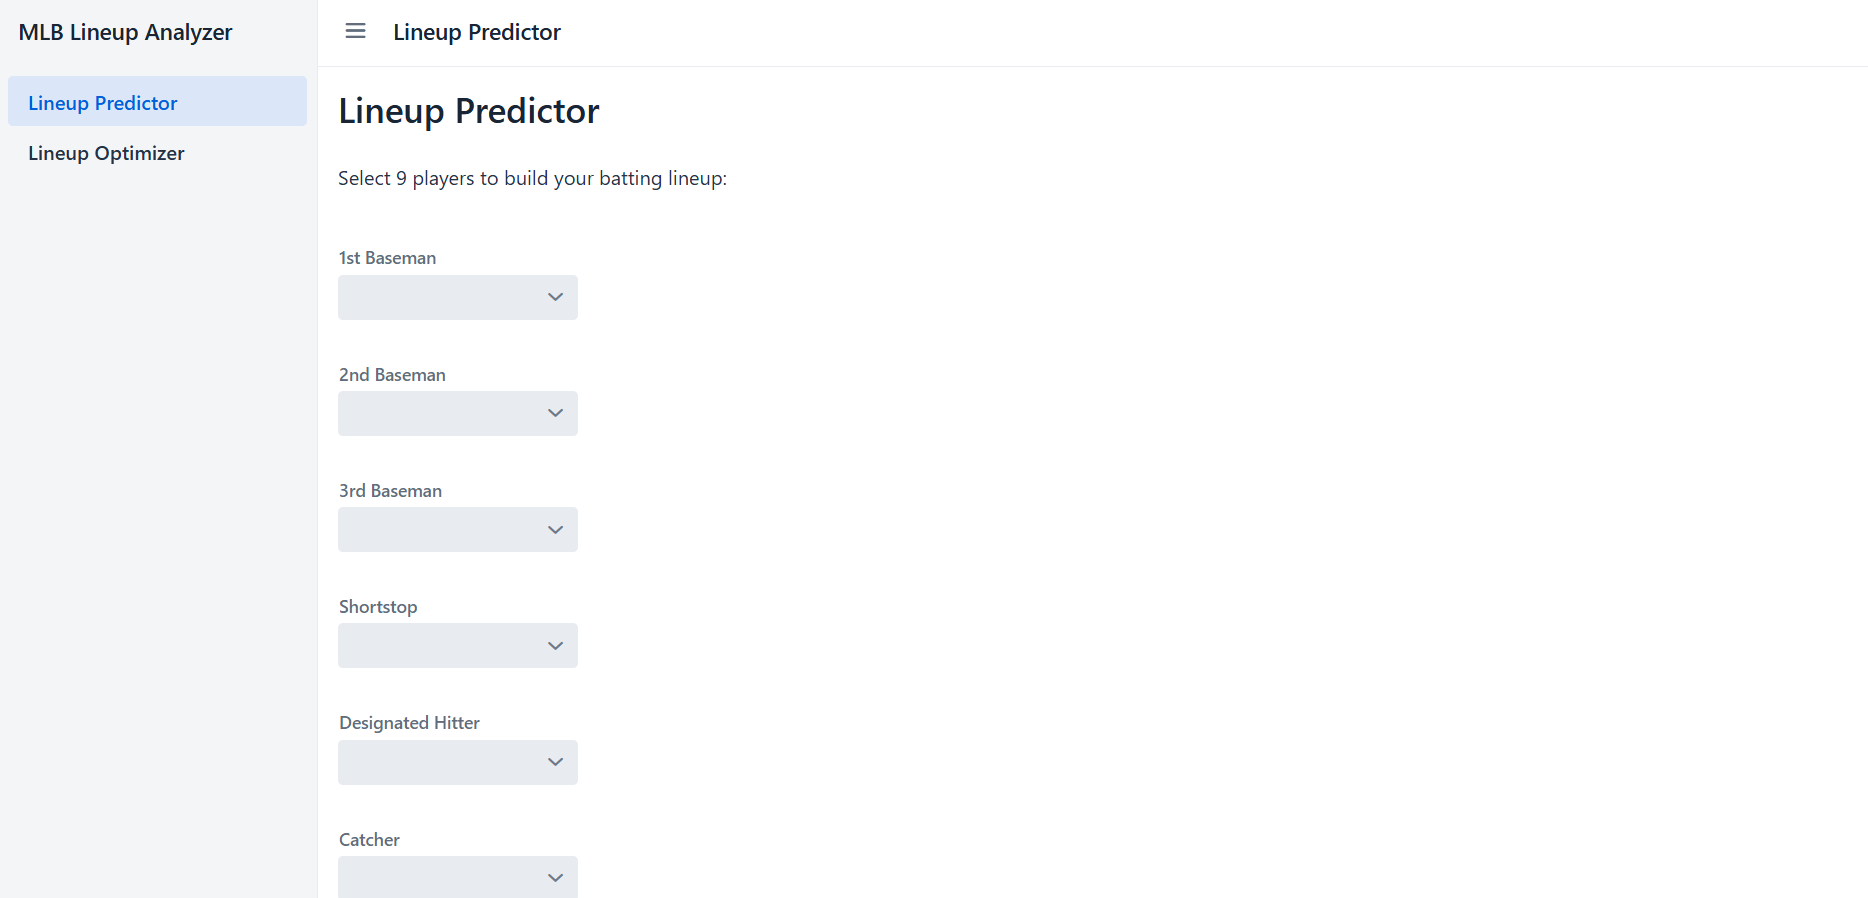
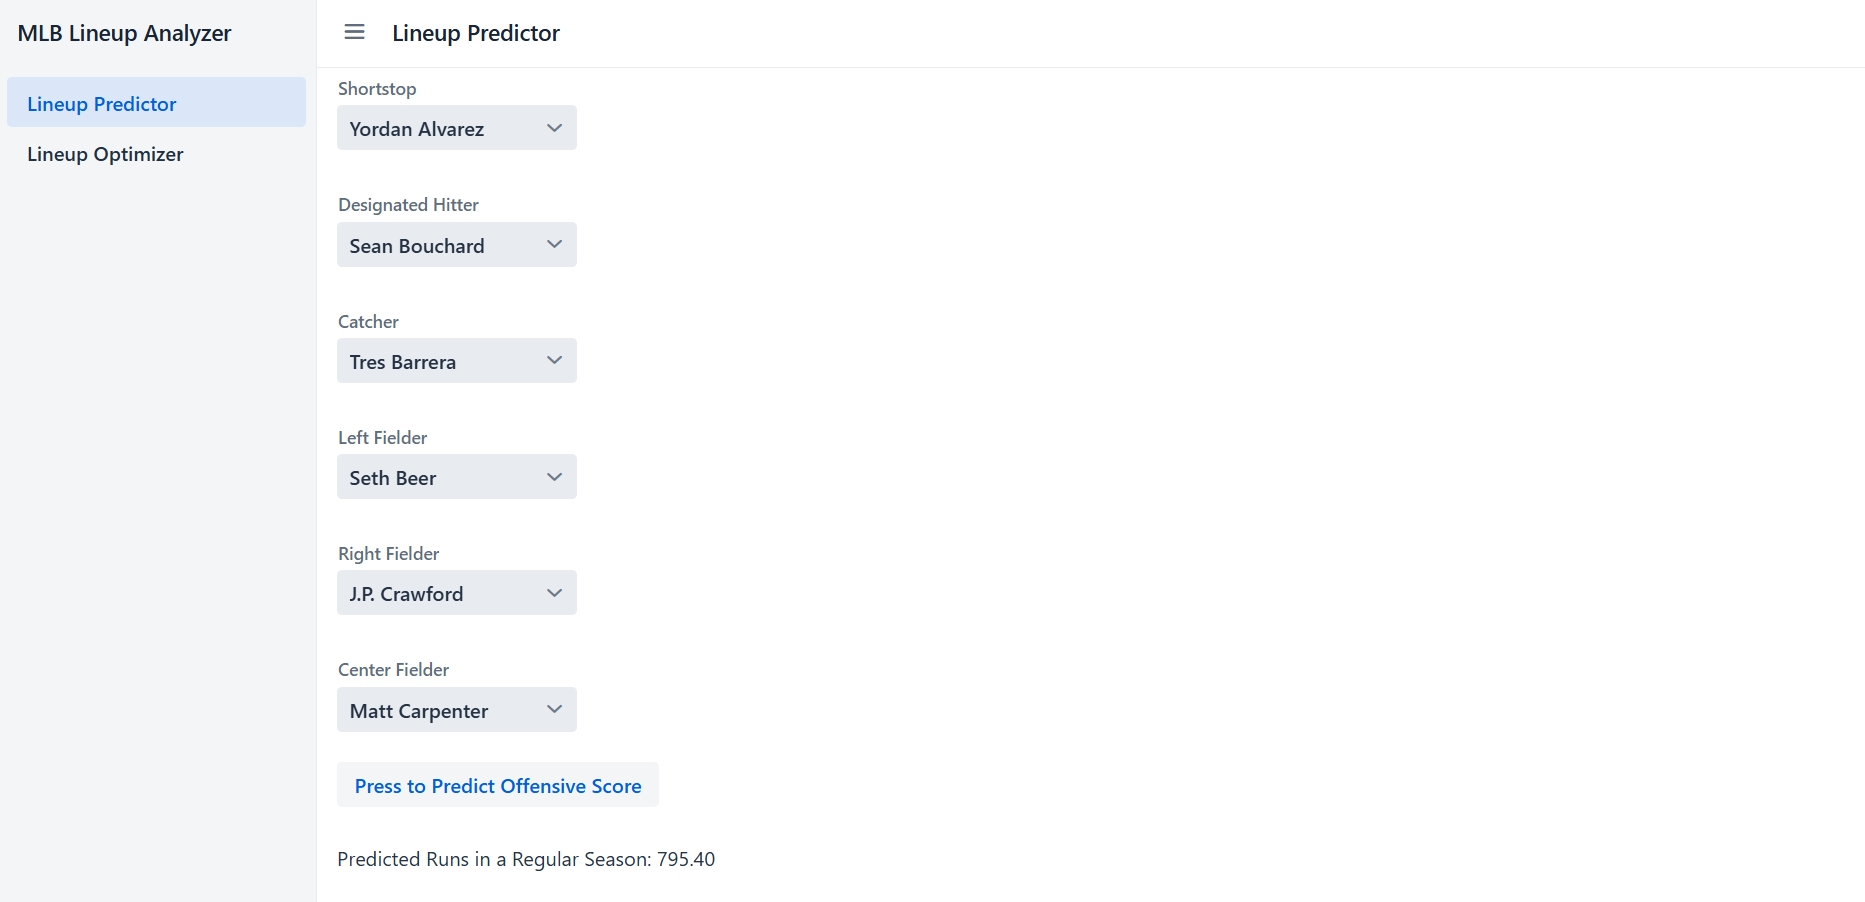
Lineup Predictor:

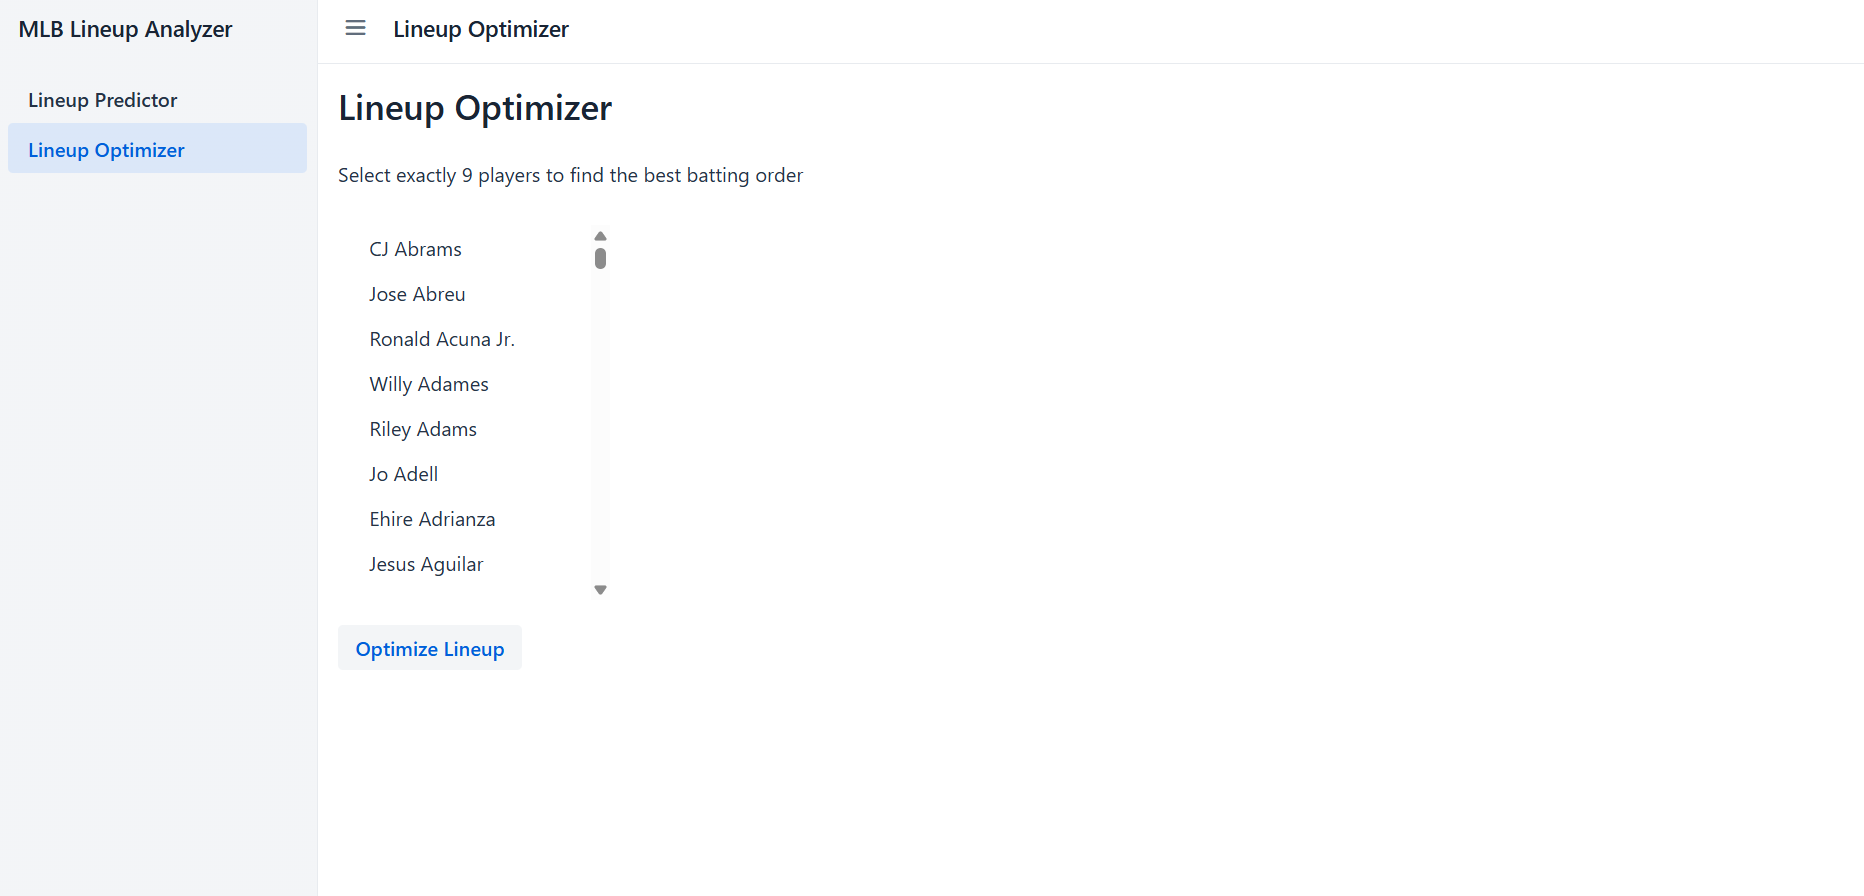
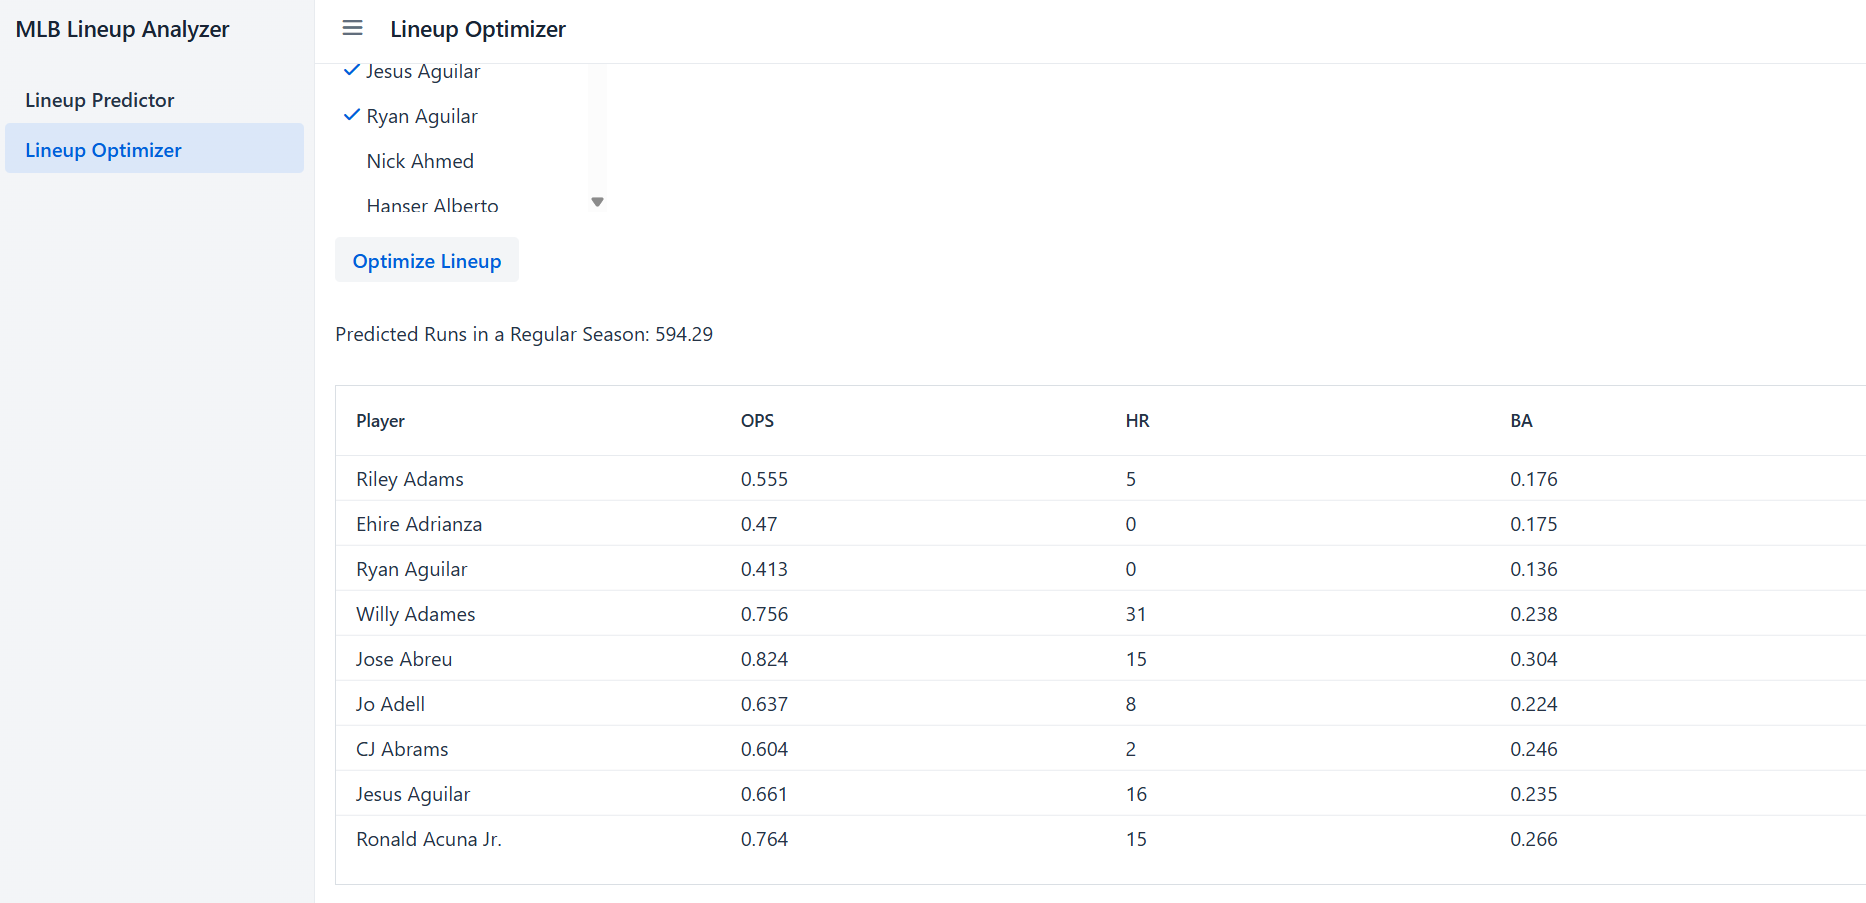
Lineup Optimizer: